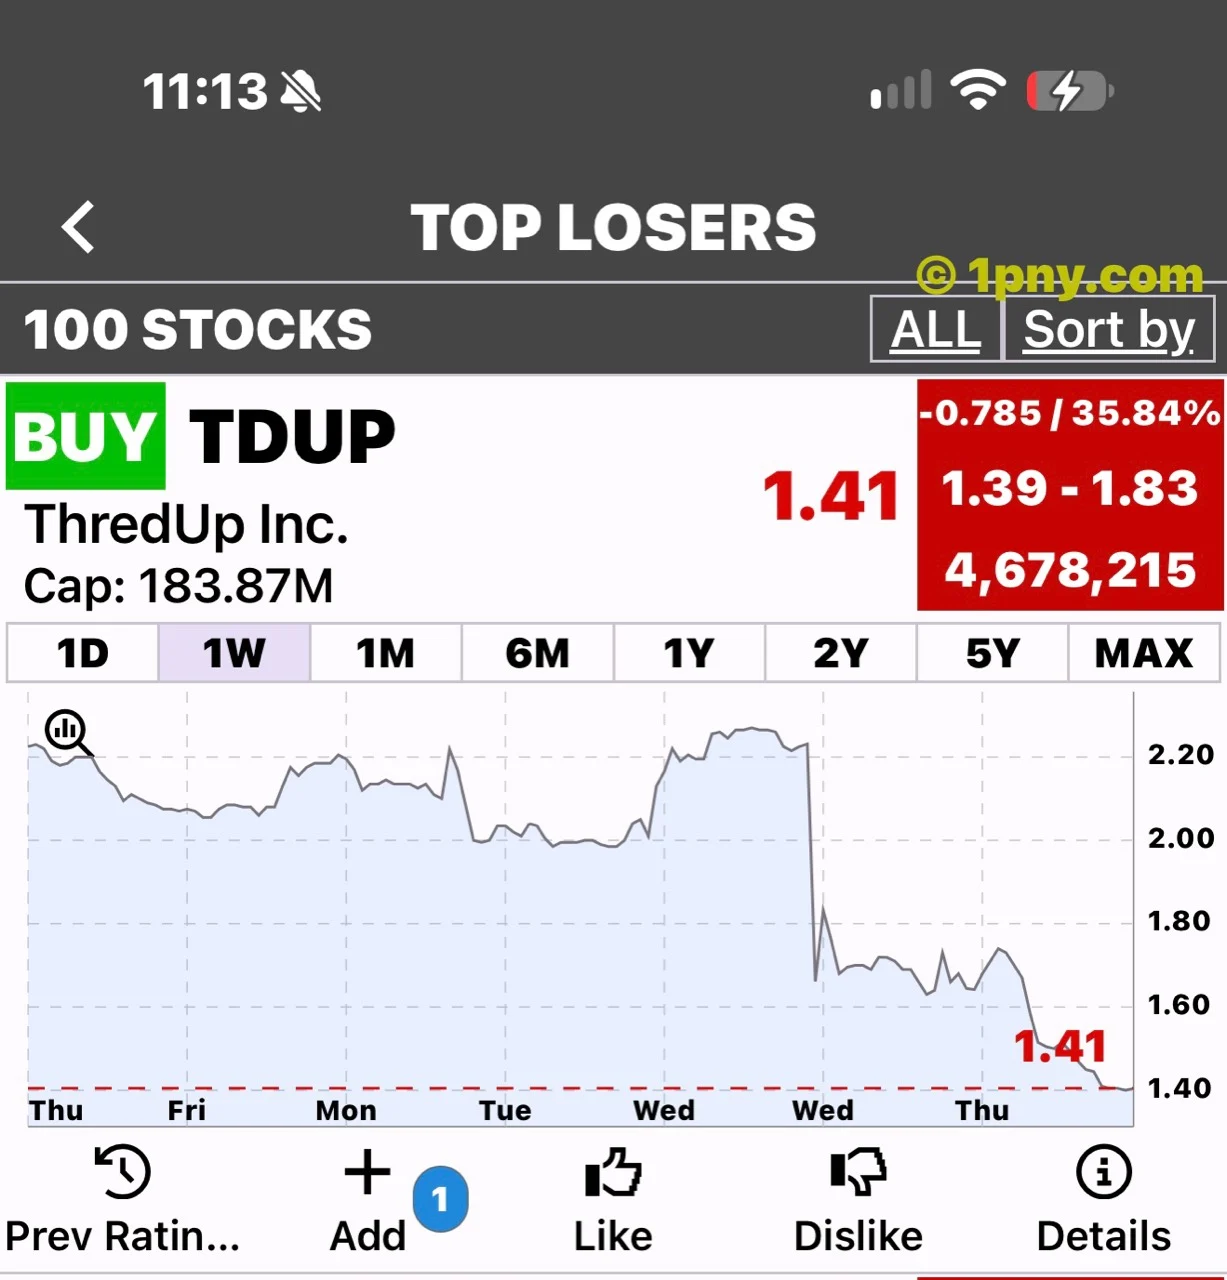
ThredUp's sharp decline followed a disappointing outlook for the holiday quarter. The supplied PennyGems snapshot shows TDUP at $1.41, down 35.84%, with a displayed daily range of $1.39–$1.83. Those are captured readings, not a live quote. The business question behind the move is whether expanding customer activity can translate into profitable growth.
The holiday forecast changed the earnings debate
In its November 4 results release, ThredUp forecast fourth-quarter revenue of $77 million to $79 million and an adjusted EBITDA margin of negative 4% to negative 2%. [Company results](https://thredup.gcs-web.com/news-releases/news-release-details/thredup-announces-third-quarter-2026-results).
StockStory reported that the $78 million revenue midpoint was 9.6% below the $86.24 million analyst consensus, and linked the selloff to the weaker forecast and wider quarterly loss. [StockStory report](https://www.financialcontent.com/article/stockstory-2026-11-5-why-thredup-tdup-shares-are-plunging-today).
That expectations gap is the clearest explanation for the market reaction. A share price incorporates an anticipated future earnings path. When management's next-quarter outlook falls materially below that path, investors may revise several quarters of assumptions rather than simply deduct one quarter's missing revenue. This is an interpretation of the financial implications, not evidence identifying the motivation of every seller.
More activity has not resolved the profit question
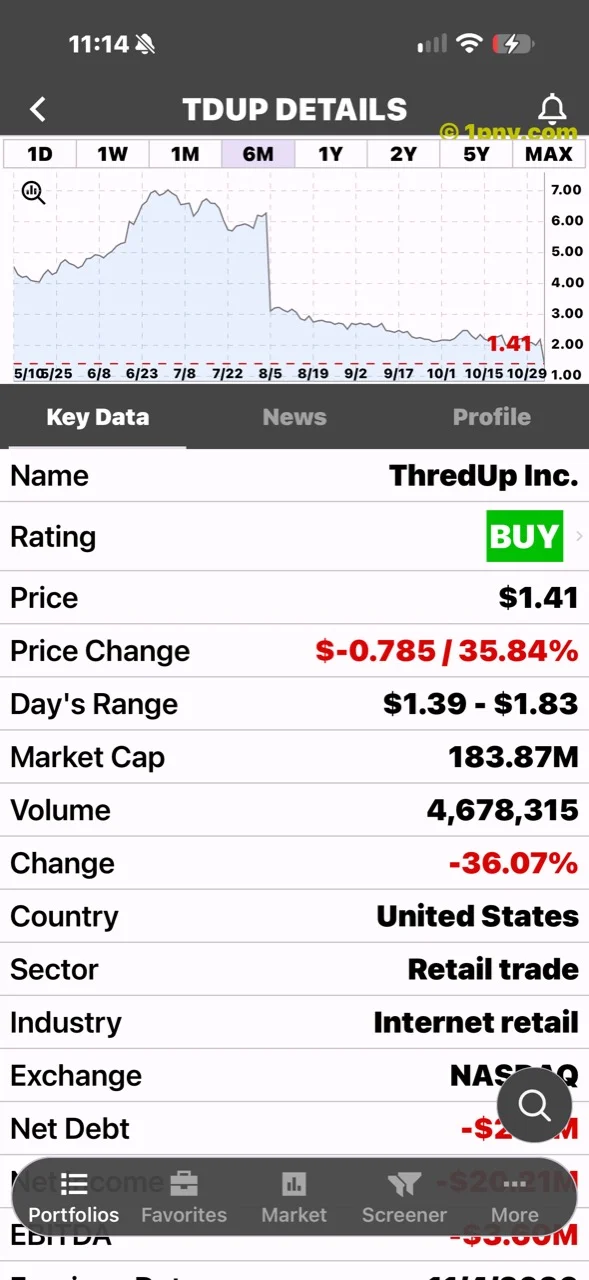
The company reported third-quarter revenue of $88.2 million, up 7%, and 1.82 million active buyers, up 16%. Its net loss widened to $5.5 million from $4.2 million, while adjusted EBITDA declined to $3.5 million from $3.8 million. [Company results](https://thredup.gcs-web.com/news-releases/news-release-details/thredup-announces-third-quarter-2026-results).
These measures answer different questions. Buyer growth describes participation in the marketplace. Revenue captures the company's sales. Profitability measures what remains after relevant expenses. Strong performance on the first measure does not guarantee progress on the others.
For a resale marketplace, the useful follow-up is therefore how efficiently additional customer activity becomes earnings. Investors should examine spending, margins and repeat purchasing together. A growing audience can support a recovery, but it is not by itself proof that the business has reached a durable operating model. Equally, a weak forecast does not establish that demand for secondhand clothing has disappeared.
Analyst revisions added to the scrutiny
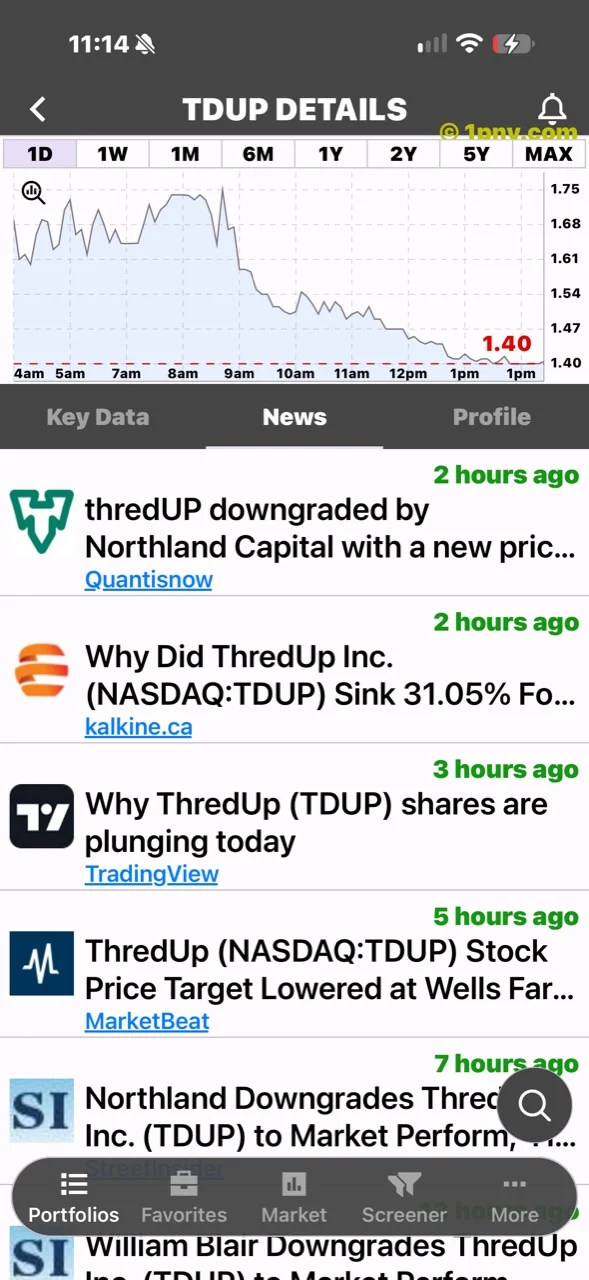
The supplied news screen includes downgrade and target-cut headlines. Separately, MarketBeat reported Northland's move from Outperform to Market Perform with a $2 target, along with William Blair's downgrade to Market Perform. [Analyst coverage](https://www.marketbeat.com/instant-alerts/analyst-thredup-nasdaq-tdup-stock-price-target-lowered-at-wells-fargo-company-2026-11-05/).
Such revisions can reinforce a reset in expectations, although they should not be counted as separate operating setbacks. They are analysts' assessments of the business, not additional losses recorded by the company. A price target is also an opinion, not a promised destination or a timetable for recovery.
What would make a recovery more credible?
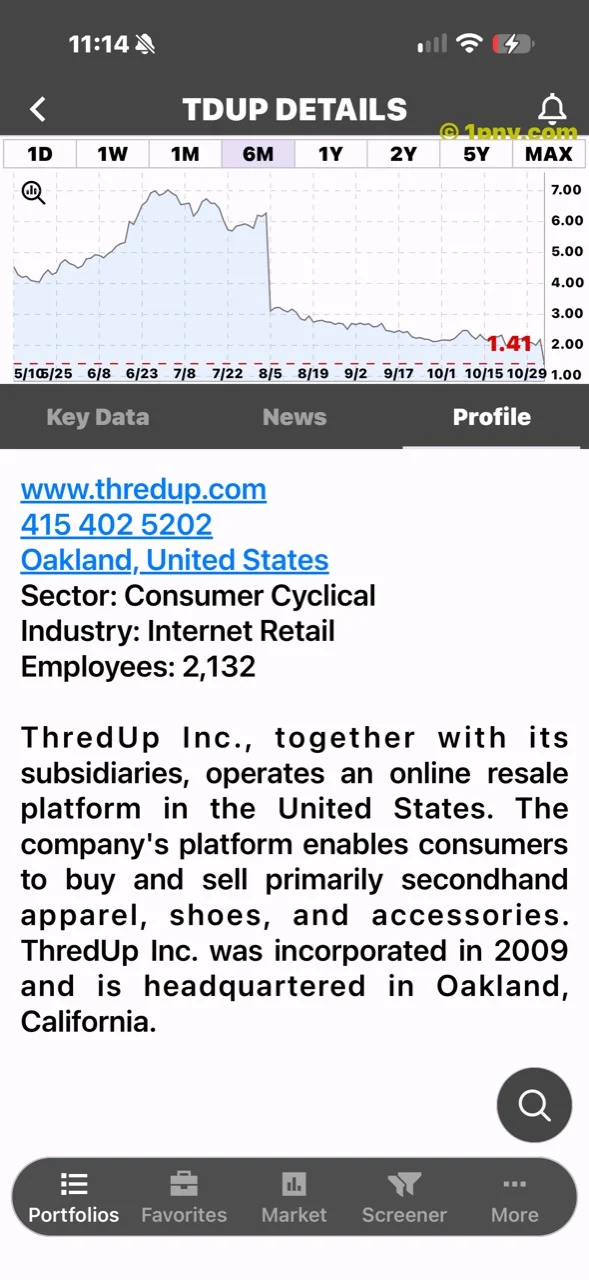
The next evidence to watch is delivery against the new forecast, followed by improvement in profitability and cash generation. Merely exceeding a reduced estimate would be useful, but investors would still need to judge whether the underlying trend is strengthening.
A more convincing recovery would combine sustained customer engagement with better economics per transaction and tighter control of expenses. Conversely, another outlook reduction could weaken confidence even if headline customer counts continue rising. These are scenarios for evaluating subsequent disclosures, not predictions of what management will report.
The large percentage decline alone does not establish that TDUP is cheap. Valuation depends on future cash generation and the capital needed to reach it. The screenshot's BUY badge belongs to the app and is not this article's recommendation.
Images: PennyGems / 1pny.com. The supplied chart, key-data, news and company-profile screens are historical snapshots captured at slightly different times; their displayed prices and volumes can differ.